
USM2 is one of the key macroeconomic indicators in the United States. It reflects the M2 money supply — the total amount of liquid money circulating in the U.S. economy and is often used to analyze inflation, economic growth, and investment trends. This metric is important not only for economists and investors but also for anyone keeping an eye on global financial trends, inflation, and potential market movements.
In recent years, researchers and traders have observed a correlation between the growth of USM2 and cryptocurrency prices, particularly Bitcoin (BTC).
What Is the M2 Money Supply?
The USM2 index shows the total volume of liquid funds in the U.S. economy, including:
- 💵 Physical cash in circulation;
- 🏦 Funds in checking and savings accounts;
- 📉 Time deposits (under $100,000);
- 💰 Retail money market funds.
In simple terms, M2 includes all money that can quickly be used for spending, saving, or investing.
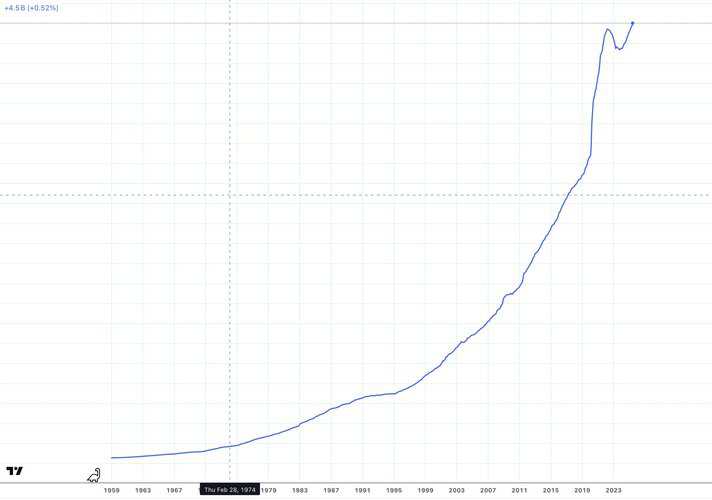
According to the Federal Reserve, USM2 reached $22 trillion in March 2025, a significant increase from $15.3 trillion in February 2020, before the COVID-19 pandemic. The substantial growth in money supply is often linked to quantitative easing (QE) policies, where the Fed increases the money supply by purchasing government bonds or lowering interest rates.
Why Is USM2 Important?
1. 📊 Economic Health Indicator
The expansion or contraction of the money supply is a major signal of the economy’s condition:
A fast-growing USM2 often indicates loose monetary policy (more money flowing into the economy).
A decline suggests tightening liquidity and potential economic slowdown.
2. 💡 Inflation Forecasting
If the money supply grows faster than the production of goods and services, inflation may follow. Monitoring USM2 helps assess inflation risks in advance.
3. 📉 Impact on Stock and Crypto Markets
Historically, periods of rising M2 often align with bull markets in stocks and crypto. More liquidity tends to drive asset prices up — from equities to gold to Bitcoin.
The Connection Between USM2 and Cryptocurrencies
Cryptocurrencies like Bitcoin are often viewed as alternative assets that attract investors during times of economic uncertainty or rising money supply. Here are the key mechanisms through which USM2 impacts the cryptocurrency market:
1. Money Supply Growth and Inflation
An increase in USM2, particularly through QE, leads to higher inflation as more money chases the same amount of goods and services. This reduces the purchasing power of the dollar, prompting investors to seek assets that can preserve value.
Bitcoin, with its fixed supply of 21 million coins, is often seen as “digital gold” and a hedge against inflation. Historically, periods of significant USM2 growth, such as in 2020, coincided with bullish trends in the cryptocurrency market. For instance, from February to June 2020, USM2 grew from $15.3 trillion to $18 trillion, and Bitcoin’s price surged in the following months.
2. Lower Interest Rates
The growth of USM2 is often accompanied by lower Federal Reserve interest rates, making traditional assets like bonds less attractive. Investors turn to higher-yield assets, including cryptocurrencies. Data suggests that periods of declining Fed rates have correlated with bullish phases in the crypto market, as capital flows into riskier assets like BTC and Ethereum.
3. Global Liquidity
While USM2 reflects the money supply in the U.S., Bitcoin is a global asset, and its price is influenced by worldwide liquidity. The growth of USM2 often signals synchronized increases in money supply in other regions (e.g., the ECB, People’s Bank of China, or Bank of Japan), amplifying capital inflows into cryptocurrencies. Studies indicate a 0.94 correlation between global M2 and Bitcoin’s price over the long term, though short-term correlations may weaken due to market events like the Terra/Luna collapse.
4. Lagging Effect
Analysts note that the impact of USM2 growth on cryptocurrencies manifests with a 60–90-day delay. This is because liquidity gradually permeates financial markets, including cryptocurrencies. For example, in February 2025, the rise in global M2 preceded a Bitcoin rally, reaching $103,000 by May 2025, aligning with a 90-day lag.
Historically, within 1–2 years after a major liquidity injection by the U.S., the so-called altseason would begin — lasting around 600–700 days.
That’s when altcoins tend to grow almost non-stop for nearly two years, marking the true altseason.
But before the liquidity injection, markets often experience a sharp correction.
Many altcoins won’t survive that phase.
Our goal in the current market environment is to capitalize on local liquidity windows — and today, one of those windows has already opened.
Historical Examples
2020–2021: During the COVID-19 pandemic, the Fed significantly increased USM2, leading to Bitcoin’s price rising from $10,000 in mid-2020 to $69,000 by November 2021. This was driven by massive liquidity injections and low interest rates.
2025: After a correction from $100,000 to $80,000 earlier in 2025, the growth in USM2 and global liquidity contributed to Bitcoin’s recovery to $103,000 by May 2025. Analysts attribute this to a weakening U.S. dollar (DXY fell by 4%) and inflows into crypto funds.
Other Factors
While USM2 plays a significant role, other macroeconomic indicators also influence cryptocurrencies:
U.S. Dollar Index (DXY): A strong dollar exerts downward pressure on cryptocurrencies, while a weaker dollar supports their growth. Research shows a negative correlation between DXY and Bitcoin and Ethereum prices.
Stock Market Indices: A positive correlation between the Nasdaq-100 and Bitcoin suggests that cryptocurrencies often move in tandem with tech stocks.
Oil Prices: A positive link between oil prices and cryptocurrencies may reflect broader risk-on market sentiment.
Practical Applications for Investors
Monitoring USM2: Investors can use weekly USM2 data published by the Fed to forecast potential movements in the crypto market. Rising M2 may signal an upcoming bullish trend.
Accounting for Lags: Consider the 60–90-day delay between money supply growth and crypto market reactions.
Hedging Inflation: In times of rising USM2, cryptocurrencies like Bitcoin can serve as a tool to hedge against inflation.
Diversification: Be aware that cryptocurrencies are influenced not only by USM2 but also by other factors, such as regulatory changes and technological developments.
Where to Track USM2?
Official source:
➡️ FRED – Federal Reserve Economic Data
Ticker: USM2 or M2SL
You can also find it on:
- TradingView (overlay it with SPX, BTC, NASDAQ, etc.);
- Bloomberg;
- MacroMicro;
- Investing.com.
Conclusion
The USM2 index is a critical indicator that influences the cryptocurrency market through mechanisms like inflation, interest rates, and global liquidity. Historical data confirms a strong correlation between money supply growth and bullish trends in Bitcoin and other cryptocurrencies.
However, investors should consider the lagging effect and other macroeconomic factors, such as DXY and stock indices, to make informed decisions. With USM2 continuing to grow in 2025, cryptocurrencies may remain an attractive asset for hedging inflation and capitalizing on global liquidity.


