
In this guide we will tell you what the US Dollar Index (DXY) is, what it was created for, what the global economy has to do with it, and how it all works. A basic understanding of the fundamentals is necessary in order to build logical chains of cause-and-effect relationships and draw your own conclusions.
The U.S. Dollar Index (USDX, DXY, DX, or informally “Dixie”) is an index of the value of the U.S. dollar relative to a basket of foreign currencies, often referred to as a basket of currencies of U.S. trading partners. The index rises when the U.S. dollar gains strength against other currencies.
Many factors influence the strength of the dollar: economic, political, military, climatic, and even to some extent speculative, such as the collapse of the dot-com bubble in the early 2000s. Factors that have had a significant impact on the behavior of the index throughout its history can be found on Wikipedia.
DXY perfectly reflects large-scale and global economic changes, such as economic crises or market pumping. When the dollar strengthens and the index rises – the markets feel bad, and vice versa, when the index falls – the markets feel better.
Chart of DXY:
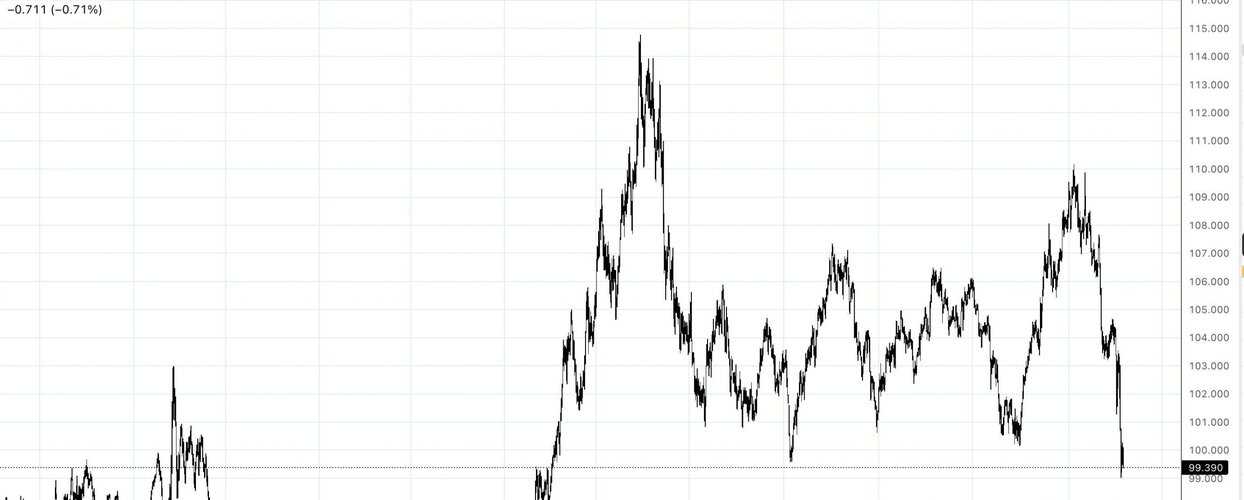
In March 2020, the DXY is at its peak, at which point the markets crash as the pandemic begins. The Fed turns on the printing press and increases the dollar money supply from about $4.38 trillion to $16.3 trillion in 3 months, an unprecedented event. After that, all that money floods into the economy, inflating inflation from 2 to 9%, and of course into the speculative markets, inflating the bubble. It is safe to say that the DXY reflects global economic processes that also affect the speculative markets.
The basket of currencies against which the DXY is calculated includes the following currencies, their percentage in the basket is as follows:
- Euro (EUR), 57.6% weight.
- Japanese Yen (JPY), 13.6% weight.
- Pound Sterling (GBP), 11.9% weighting.
- Canadian Dollar (CAD), 9.1% weighting.
- Swedish krona (SEK), 4.2% weighting.
- Swiss franc (CHF), 3.6% weight.
There is the dollar and there are other currencies of central banks of different countries, but it remains unclear how exactly the index itself is formed and why the dollar is against the leading economies of the world. That is, the fact that for example USD to EUR has its own chart is clear, but what exactly affects the strength or weakness of the currency, what factors and how it is measured, what are the reasons. Let’s try to understand.
History of the emergence of the US dollar index
The Dollar Index first appeared in early 1973. Initially, the notional base value of the index was set at values of 100,000. This was something of a response to the end of the Bretton Woods system, the days of the gold standard, when the dollar was pegged to gold and other central bank currencies were pegged to the dollar at a fixed rate. The economy and trade relations were in a kind of equilibrium, the benchmark being gold and the dollar pegged to it.
The Bretton Woods system required countries to guarantee the convertibility of their currencies into U.S. dollars within 1% of the fixed parity, with the dollar being converted into gold bullion for foreign governments and central banks at a price of $35 per troy ounce of pure gold: 0.88867 grams of pure gold per dollar. Since then, gold has risen on the Ix, while the dollar has lost purchasing power.
The system also provided for closer cooperation between countries to prevent future competitive devaluations of national currencies, and so the International Monetary Fund (IMF) was created to monitor exchange rates and provide reserve currency to countries with balance of payments deficits.
On August 15, 1971, the United States stopped converting the U.S. dollar into gold, effectively ending the Bretton Woods system and turning the dollar into an unsecured fiat currency, thus ending the era of the gold standard, but the U.S. dollar continued to serve as the world’s reserve currency.
Chart of inflation in the USA:
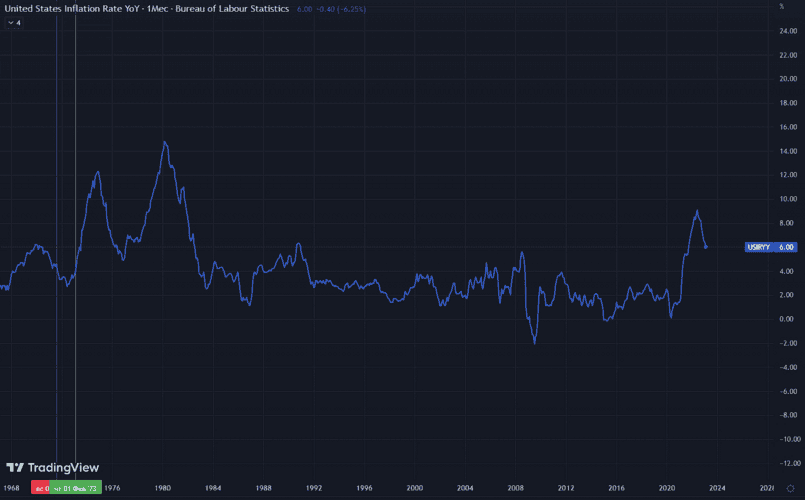
Red vertical line – U.S. refused to unilaterally exchange dollars for gold.
Green vertical line – creation of the DXY dollar index.
International Monetary Fund and its role in the world economy
The International Monetary Fund (IMF) was conceived at the Bretton Woods Conference during the Second World War as a supranational structure to regulate world trade to prevent trade wars and as a tool to balance national economies. Officially established after the end of World War II on December 27, 1945, it began public operations on March 1, 1947.
IMF approval was required for any change in the exchange rate of a national currency against the dollar over 1%; if a state decided to make such a change on its own, without IMF approval, such a state was deprived of access to financing from the IMF and other supranational financial structures.
After the abandonment of the gold standard, there was an attempt to repeat the situation and raise the fixing limit from 1% to 2.25% in the Smithsonian Agreement, but within a few years all industrialized countries let the exchange rate of their national currencies float against the dollar, without rigid fixing.
Floating refers to the buying and selling of the dollar in the domestic market to maintain an acceptable exchange rate for the national currency. At the time, however, the U.S. was committed to backing its dollars with gold, making the U.S. dollar an ultra-safe asset and more convenient than gold.
In 1945, it was the U.S. that had the overwhelming economic and military power, the European economy was in decline after the devastation caused by the Great War, this also contributed to the U.S. dollar becoming the world’s reserve currency.
How to Measure the True Value of the Dollar?
The exchange rate of any national currency depends on the country’s economy and, in particular, its trade balance: imports and exports of goods and services. All international trade transactions are largely conducted in dollars, more exports means the country has more currency, more imports means less currency. More foreign currency – the rate of the national currency is stable or strengthening, less currency – the currency is weakening, this is if very primitive and short.
It should be understood that national banks have a certain set of tools to control and direct the exchange rate, such as the ability to change the interest rate and various stabilization funds, but we have described the principle of operation.
Two facts follow from the above:
- No fiat currency in the world is pegged to anything.
- The exchange rate of a national currency depends on the economic strength of a country.
Accordingly, to understand the strength of a currency, you need to compare it to another currency, but in the short term, such a comparison will not give a true picture, because there may be other factors: speculation, currency intervention by the regulator, and so on.
To better understand the “weight” of the currency, it is necessary to compare it with several other currencies, the most stable and strongest economies in the world. And it is this function that the Dollar Index DXY performs.
Based on the reverse logic, the Dollar Index, on the other hand, reflects the state of the U.S. economy in relation to other central bank currencies.
Using the DXY index for the crypto market
There is a correlation between the dollar index (DXY) and the stock market, interestingly, since 2019, some correlation with bitcoin has begun to be seen. This can be explained by the fact that after 2017, the cryptocurrency market saw more liquidity and a large number of new entrants of different caliber:
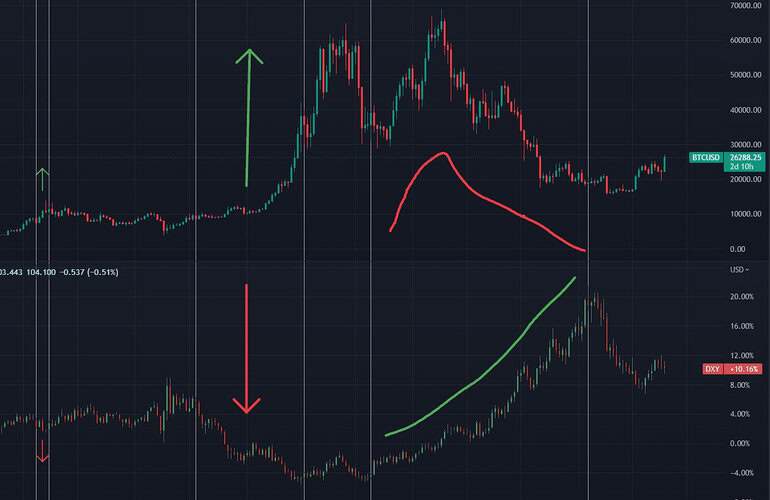
The correlation is very visible over long periods of time. When the dollar index starts to fall, bitcoin rises; when it starts to rise, bitcoin falls.
Let’s looking at and analyzing the chart of the Dollar Index separately:
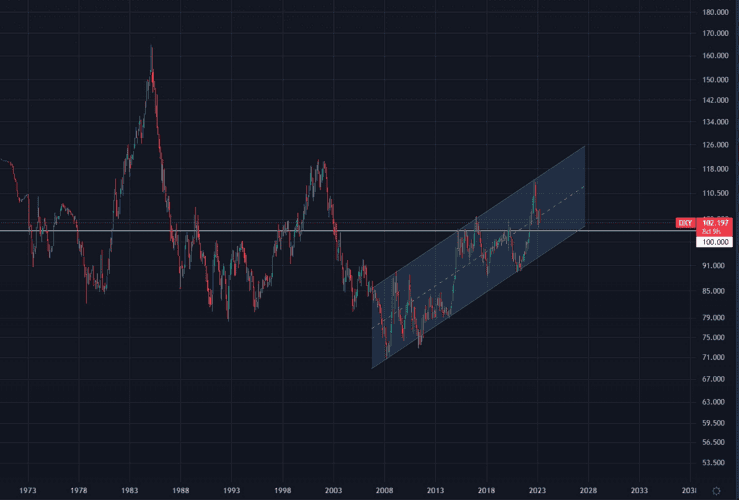
The white horizontal line on the chart is the beginning of the index or, conditionally, the state of equilibrium. If we look at the whole chart globally, we can see that the quote is tending towards equilibrium, i.e. towards the index 100. However, we are also following local trend movements of the index, the last of which we have highlighted in a parallel rising channel:
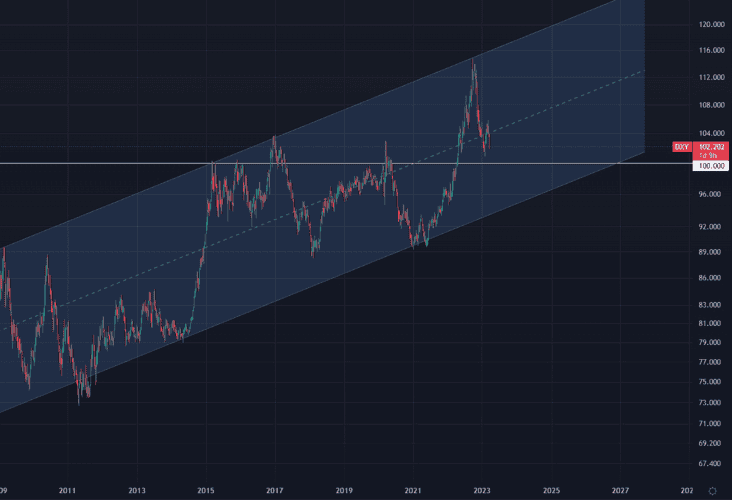
An ascending parallel channel was formed from March 2008 until 2023, the price is still in the channel.
The chart clearly shows that the index has been in an ascending channel since 2008, especially the resistance of the channel shows itself well. If we apply secondary trend lines, they also worked almost flawlessly on the history. At this moment, the index tested the channel meridian as resistance, bounced and headed for support.
On such large timeframes you can understand the general trend. If we add events that are happening in major economies and events from the cryptocurrency industry from the recent past, we can draw some conclusions about the future course of the index, as well as how it could potentially affect the price of bitcoin and the crypto market as a whole.
Conclusion
The DXY Dollar Index cannot be used as the sole indicator for making or supporting investment decisions, but it is a very good additional factor that may be worth considering for understanding medium and long-term market trends.
Traders and investors can use DXY as an indicator to predict the movement of cryptocurrencies. For example, an expected weakening of the dollar (due to loose monetary policy) can be a signal to buy BTC.
However, due to the instability of the correlation, it is better to combine DXY analysis with other indicators (e.g. S&P 500 or VIX fear index).
The Dollar Index has an inverse correlation with cryptocurrencies, but it is not absolute and depends on the context. It’s important to consider economic data, market sentiment and other assets for accurate predictions.


