Cryptocurrencies, like other investment instruments, are in one way or another dependent on the macroeconomic situation, the state of the financial system and monetary policy. Liquidity is an important macroeconomic factor that affects all market participants.
What is liquidity?
In economics, liquidity is the property of a commodity or asset that characterises the ability to exchange it for money or its equivalent in the shortest possible time without significantly affecting the market price.
In the above formulation, the key component of this indicator is the availability of money in a given market. Therefore, CrossBorder Capital’s analysts define liquidity as the total amount of money and credit available in the financial markets after the needs of the real economy have been met.
Based on this concept, the company has developed its own Global Liquidity Index (GLI), as well as related financial and economic indicators such as the Market Liquidity Index and the Market Liquidity Index.
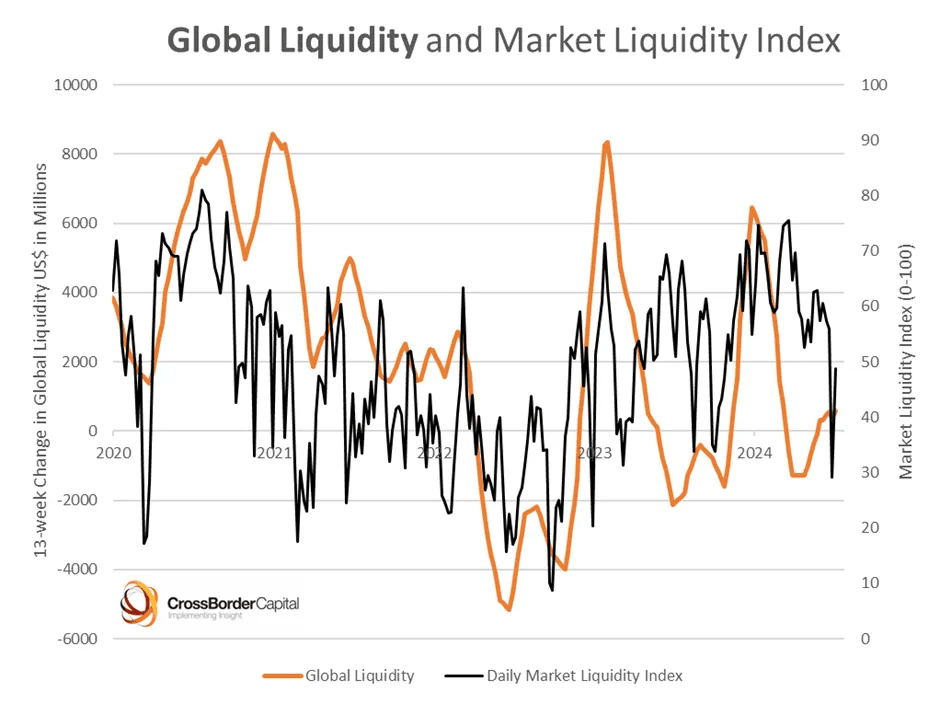
The Global (World) Monetary Supply technical index works on a similar principle – it tracks the balances of the central banks of the most populous countries. This means that it reflects the money supply available in the markets, but unlike the GLI, it does not take into account loans and indirect factors that influence the index.
For the cryptocurrency industry, dollar liquidity plays the most important role, both because of the currency’s overall importance to the global economy and its dominant position in the digital asset markets. For example, according to CoinMarketCap, at the time of writing, two dollar-pegged stablecoins – USDC and USDT – account for more than 80% of total trading volume, and most services use dollar-denominated asset values for transactions.
The importance of dollar liquidity to the crypto market has been repeatedly noted by Arthur Hayes in his essays.
How is liquidity measured?
To measure liquidity, we need to break this indicator down into its components. Based on the definition above, this characteristic of an asset is influenced by
- the time it takes to make a sale
- the difference between the actual value and the nominal value (slippage)
Accordingly, the less time it takes to execute a trade and the smaller the price spread, the higher the liquidity and, as Nasdaq notes, the cheaper the conversion. According to Forbes, the most liquid assets are cash, government bonds, certificates of deposit, stocks and some other instruments.
For example, if we compare Bitcoin and a spot bitcoin ETF from the perspective of the management company, the shares of the latter will be less liquid compared to the underlying asset, as their full redemption cycle takes much longer than buying or selling cryptocurrency on the exchange. At the same time, the end buyer may not feel the difference due to the existence of a liquid derivatives market.
To determine the liquidity index in a particular market, traders can use statistics such as trading volume, price spreads, depth of the exchange stack at different levels and average execution time of trades. These are used to create liquidity indices for individual assets, such as the BLX.
In the absence of constraints related to legal formalities, asset characteristics and other non-economic reasons, the two main liquidity characteristics – time delays and slippage – are influenced by demand. That is, the availability of a sufficient number of people willing to exchange an instrument for money.
For this reason, most global liquidity indices are based on the amount of money available for economic agents to use in their transactions. And since the amount and availability of money is controlled by central banks and other financial regulators, they do have some influence on liquidity.
It is important to note, however, that the correlation between regulators’ actions and global liquidity and the liquidity of a particular market can be heterogeneous. Some assets may experience a liquidity crisis even when overall performance is rising.
What influences liquidity?
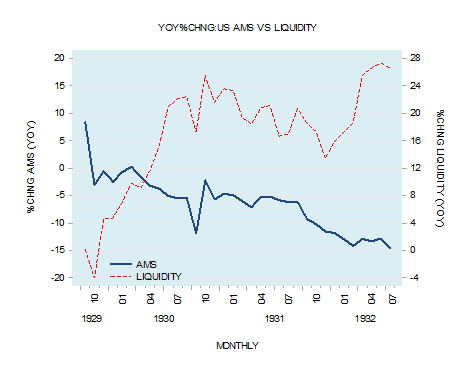
We have pointed out above that common indices of global liquidity actually identify this indicator with the available money supply, which does not always correctly reflect the situation in the market. Analysts at the Mises Institute offer a more complex and comprehensive approach, looking at liquidity as a balance between money supply, economic activity and inflation.
Money supply
Money supply and liquidity tend to have a strong direct correlation, which is confirmed in particular by CrossBorder Capital data.
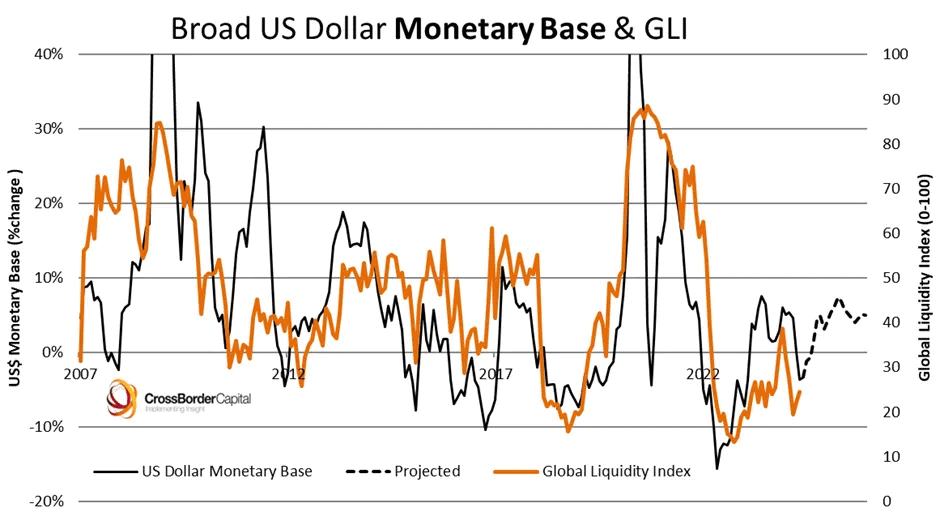
The Mises Institute points out that this relationship is based on the function of money as a universal medium of exchange and acceptance. Participants in economic relations have no incentive to hold surplus money, so they seek to get rid of it by exchanging it for goods or services.
As a result, when the supply increases through the issuance of money, the creation of credit or other means, this surplus is channelled into the markets, thereby increasing the liquidity of assets. Gradually, this relationship normalises as prices rise.
If the money supply shrinks while the quantity of goods and services remains the same, the opposite process takes place – the demand for money as a medium of exchange increases, forcing market participants to exchange assets for it. The result is a reduction in liquidity, which is eventually offset by a fall in prices.
Economic activity
Economic activity refers to the rate at which goods or services are produced. This means that if money reflects the demand side in terms of liquidity, economic activity reflects the supply side.
Therefore, if the growth of the money supply is accompanied by an increase in the number of assets on the market, the liquidity indicator does not change. Similarly, a slowdown in economic activity, even without additional money issuance, leads to an increase in liquidity because there is more money relative to available assets. And vice versa.
As with changes in the money supply, liquidity surpluses are eliminated or compensated for by rising or falling prices.
Inflation
The IMF defines inflation as a measure of the increase in the cost of goods and services over a given period.
Based on the above, inflation is a consequence of an increase in liquidity in the market, either due to the issuance of money or due to a reduction in production, and is necessary to eliminate the resulting excess of means of exchange. Accordingly, inflation and liquidity have a direct relationship, which is not always the case for the relationship between inflation and money supply growth.
The Mises Institute suggests calculating the effect of the above indicators on liquidity using the following formula
Growth in liquidity = Growth in money supply – Growth in economic activity – Growth in inflation
If we translate this formula into an understandable language, it turns out that, from the point of view of the Mises Institute, liquidity is the volume of money in circulation, adjusted for inflation and the rate of production of goods. It is not quite correct to identify liquidity only with the money supply, because in some situations they can be inversely correlated.
What does the central bank rate have to do with it?
It is not uncommon to associate increases or decreases in liquidity with changes in the federal funds rate. This is particularly true of the Fed. The link is not always obvious, because the rate cut itself does not lead to money creation. However, the Fed influences several aspects, for example through the regulation of federal funds:
- the return on excess cash reserves held on the central bank’s balance sheet
- the level of payments on government bonds and Treasury bills;
- the cost of commercial loans and mortgages.
The first two items are related to the “liquidity accumulators” in the form of government bonds and the reverse repurchase programme. The higher the yields on these instruments, the more investors are incentivised to invest in them and the less excess money flows into other markets, such as equities. Accordingly, by lowering the interest rate, the regulator is ‘releasing’ this liquidity, forcing money funds to seek more profitable investment opportunities.
The third is the availability of bank credit – the main mechanism for creating money in developed economies. High interest rates reduce demand from businesses and individuals because it is ‘expensive’ money, while lower rates consequently increase demand and boost overall lending.
As a result, lower rates lead to faster money (and liquidity) growth, and vice versa – higher rates contribute to slower lending and a partial withdrawal of liquidity from the economic system.
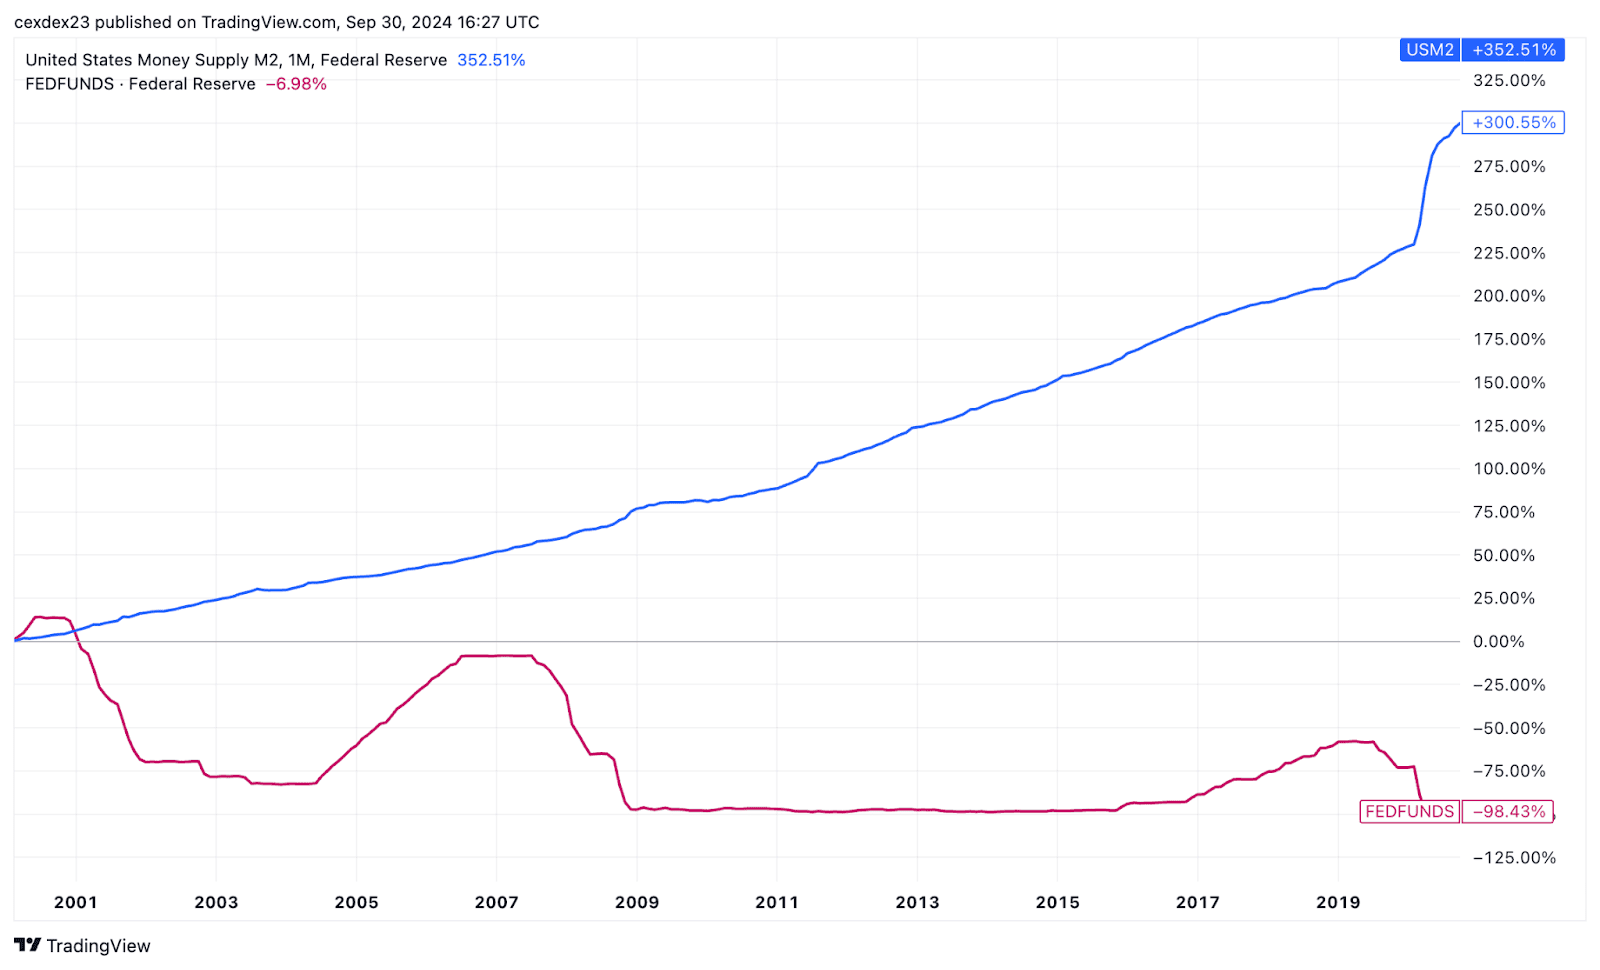
However, as the chart above shows, the biggest influence on the money supply is the direct or hidden issuance of currency by the central bank as part of economic stimulus programmes.
How liquidity affects asset prices
The general mechanism of how liquidity affects prices is essentially outlined in the previous section and boils down to the fact that an increase in the amount of free money on the market, while the amount of goods and services remains the same, leads to an increase in the value of the latter, thus triggering an inflationary mechanism.
This process is based on the above-mentioned rule according to which the participants in economic relations try to get rid of surplus money, so that all the available money supply is distributed among markets and assets.
Exactly the same mechanism is used in the DeFi liquidity pools. For example, if the ETH/USDT pool sees a large increase in the volume of stablecoins relative to the cryptocurrency, the value of ETH will increase proportionally. The difference, however, is that while DeFi requires ownership of both tokens to provide liquidity, TradFi participants are not bound by this rule and can place large amounts of both cash and assets on the markets separately, creating an imbalance of supply and demand.
The key question is where exactly the free money supply goes first and how it moves between markets. The answer depends on a number of factors, including
- The mechanism for creating and distributing the money supply;
- Regulatory requirements on the risk profile and investment objectives of financial institutions;
- The availability of particular instruments to economic agents;
- the pricing mechanism of these or these assets.
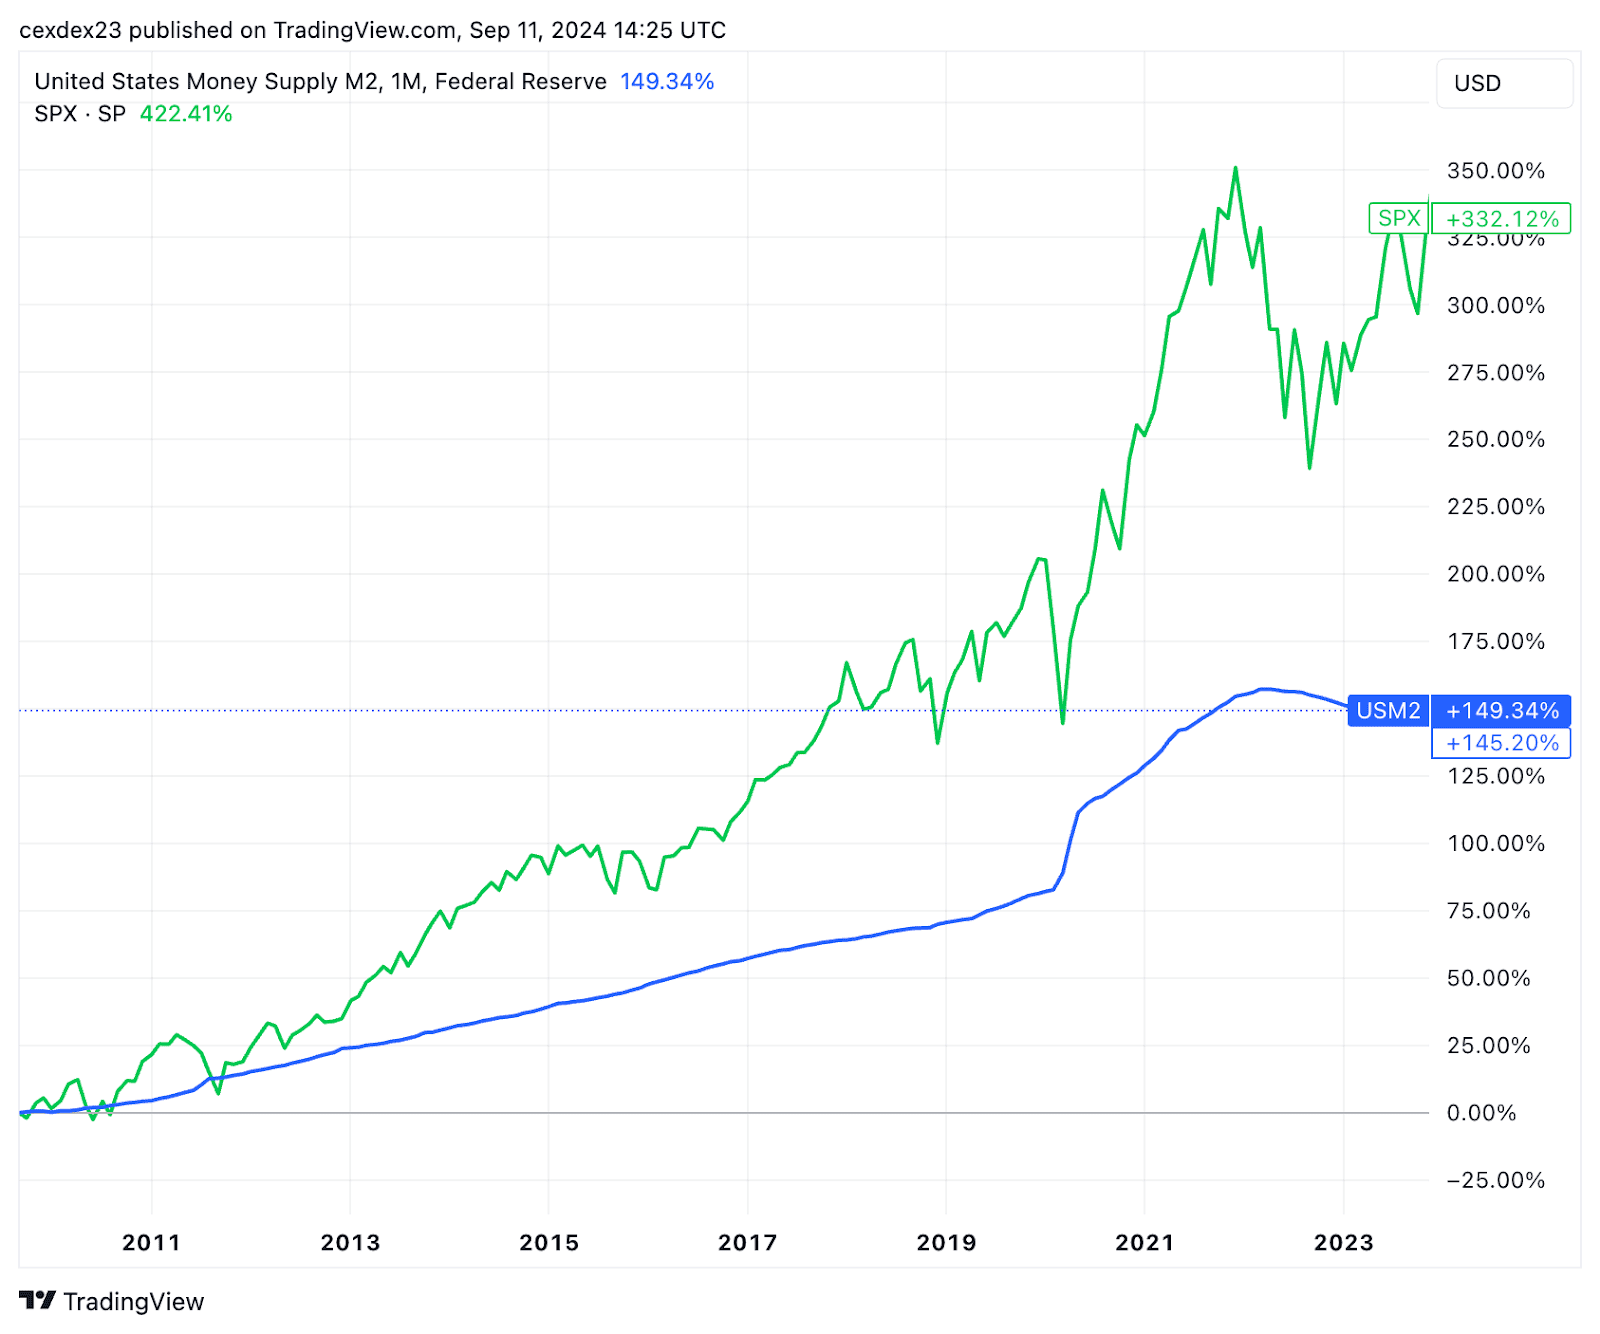
The correlation between the growth of the money supply and the growth of a particular market is usually established on the basis of historical data. For example, the graph below shows a strong correlation between the supply of US dollars and the level of the S&P 500 index.
At the same time, every major economy has assets that react faster or more strongly than others to an increase in the money supply. For example, the CSI 300 index (the Chinese equivalent of the S&P 500) reacted with rapid growth after the People’s Bank of China announced the largest monetary stimulus package since the COVID-19 pandemic to pull the economy out of deflation.

The movement of liquidity between countries and assets is not always obvious and is the subject of expert research. One example is the yen-funded carry trade, which actually facilitates the flow of money from the Japanese economy to the US bond market.
Given the complexity and diversity of available assets, liquidity channelling mechanisms and regulatory specificities in each country, it is difficult to predict in advance the impact of an increase in the money supply on a particular asset. As a result, estimates are often based on historical experience.
Rising liquidity and Bitcoin value
In his essay ‘Bullrun… Lingers’, Arthur Hayes argued that bitcoin is one of the most liquid instruments in the market. This is generally supported by the first cryptocurrency’s quotes and data from CrossBorder Capital.
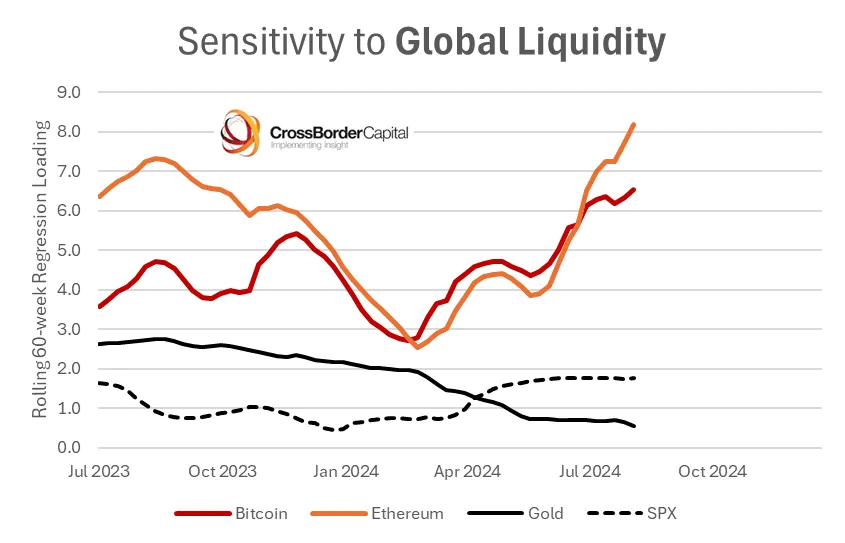
Hayes also describes bitcoin as a ‘dump valve’ for the excess fiat money that he believes is being created by governments’ attempts to suppress market volatility and the impact of unpredictable events. The most obvious illustration is a comparison of the value of the first cryptocurrency and the money supply of the world’s largest economies.
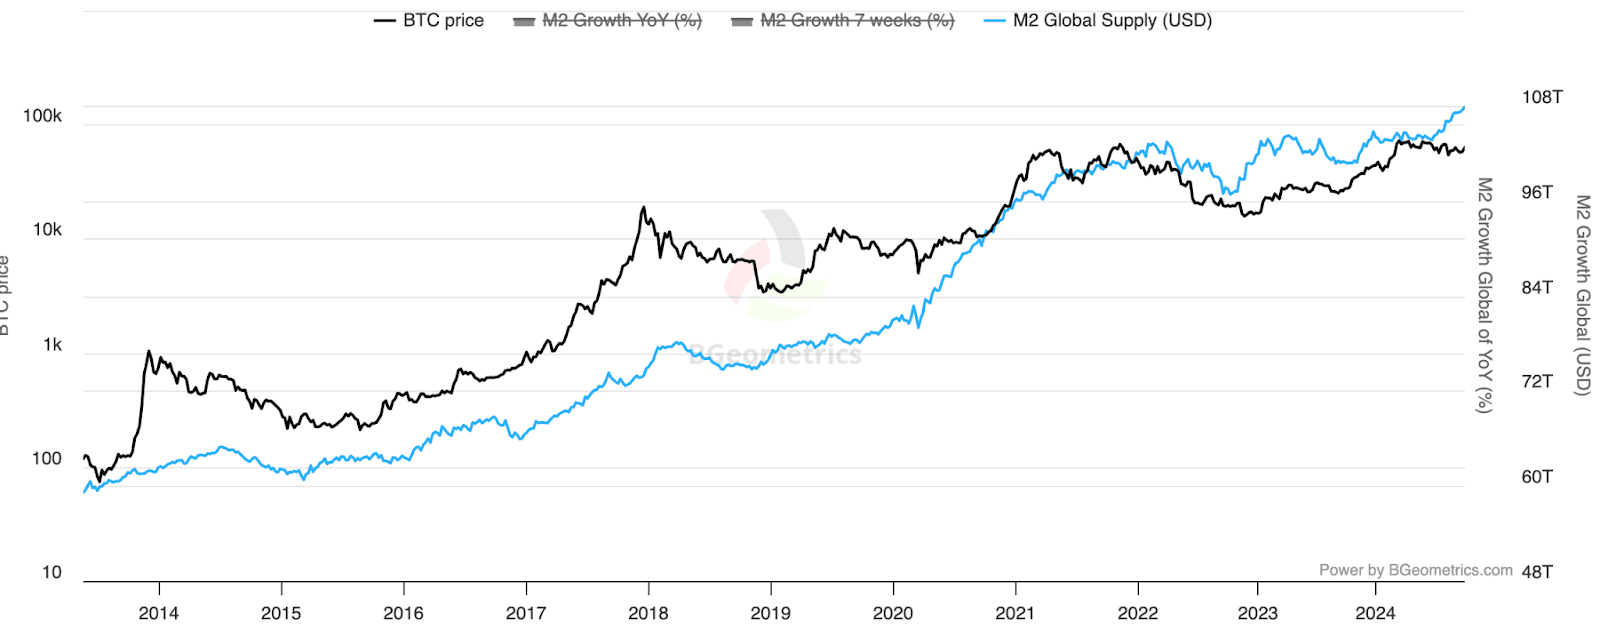
Neither Hayes nor the analysts at CrossBorder Capital explain why bitcoin has such a strong correlation with liquidity and money growth. This is probably due to the first cryptocurrency’s positioning as ‘digital gold’ and its limited supply, which makes it perceived by many investors as a safe haven asset.
In addition, the use of a faster and more open blockchain infrastructure and fewer regulatory restrictions in many jurisdictions make bitcoin more accessible compared to traditional gold or stock market assets. This is particularly relevant for retail investors, who can invest in cryptocurrencies to protect their savings without access to banking services or brokerage accounts.
It is noteworthy that the statistics reduce bitcoin’s dynamics to only one option for increasing liquidity – an increase in the money supply – although we already know that liquidity can also increase through a decline in production. However, neither in March 2016 nor in February 2020 or 2023 did the value of the cryptocurrency increase, despite a slowdown in global economic activity during these periods, while the money supply remained unchanged. This confirms the prevailing anti-inflationary value of bitcoin.
After all, the volume of money supply and the liquidity it creates is one of the most important indicators of the growth of Bitcoin and the cryptocurrency market as a whole. And while it is difficult to say for sure what the reason is for investors to prefer digital assets over other instruments when investing excess cash, statistical indicators show that the first cryptocurrency, along with the stock market, shows strong growth every time governments turn on the “money printer”.


