We cover the fundamental knowledge every trader should have. There will be no information in this level on how to execute your own trades based on technical analysis. Success flows from a strong basic knowledge and is difficult to achieve if you throw yourself straight into the deep end.
What’s trading?
Before we get deeper into this topic, it’s important to know exactly what trading means. Many people think that trading is the same as investing, but this is not entirely true.
What’s trading?
Trading is the buying and selling of assets with the goal of making a profit in a short period of time.
What’s investing?
Unlike trading, investing relates to the long term. By investing, you sacrifice money or time to expect future profits.
What’s the difference?
As mentioned, trading relates to the short term, and investing to the long term. It should not be made more complicated than it is. By investing, you expect your investment in a project or activity to become more valuable in the long run, but by trading, you aim to make short-term profits by buying and selling assets.
Type of Traders
There are different types of traders. It is not essential to know what kind of trader you are going to be before you start trading. However, at a later stage, choosing what kind of trader you are will be important. By knowing this, you can describe your goals more precisely and thus achieve them faster.
The scalp trader
Scalp traders focus mainly on trades that last minutes or hours. They often place several trades per day with which they aim to make small profits. Due to the high volume of trades, these small profits can add up to large amounts of profits on a daily basis.
Scalp trading = placing short-term trades
The swing trader
Swing traders deal primarily with trades that last for hours, days, or weeks. The trades that are opened will often remain open for several days. The swing trader focuses more on making relatively large profits with a medium volume of trades.
Swing trading = placing short-term and medium-term trades
The position trader
Position traders focus mainly on trades that last for months or years. On an annual base, a small number of trades are opened, but a lot of money is invested. This allows the position trader to realize large profits with a low volume of trades.
Position trading = placing long-term trades
Price movement
Before you start reading about terms such as accumulation, distribution, and consolidation, it is essential to understand basic economics. What is explained here is pure economics and does not just apply to the price graphs of charts used by traders.
Prices vary from period to period due to the difference in supply and demand.
Increasing price
1. If there is more demand than supply;
2. The price will increase.
Decreasing price
1. If there is more supply than demand;
2. The price will decrease.
Constant price
1. If there is as much demand as supply;
2. The price remains the same.
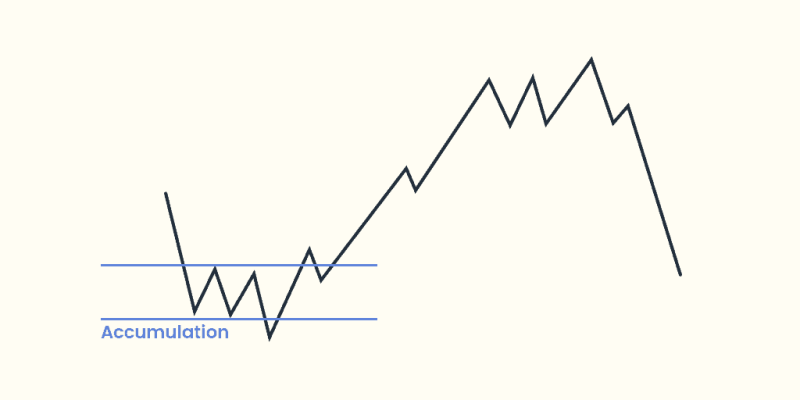
Accumulation
Accumulation represents a period of time prior to a strong increase in the price of an asset. During this period, the demand increases, and the transaction volume of an asset increases. This means that more transactions are performed, and people buy (accumulate) an asset. When accumulation occurs, an asset is said to be “under accumulation” or “being accumulated.”
Distribution
Distribution represents a period of time prior to a sharp decline in the price of an asset. During this period, the demand decreases, and the transaction volume of an asset decreases. This means that people sell (distribute) their asset and fewer transactions are performed. When distribution occurs, an asset is said to be “under distribution” or “being distributed.”
Consolidation
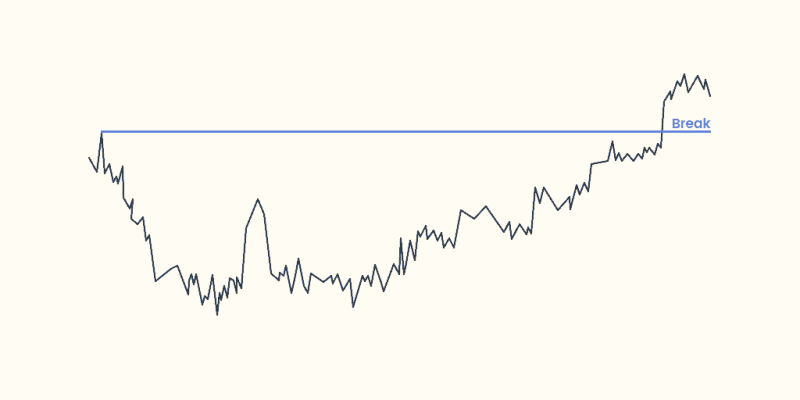
Consolidation is the word that defines a sideways price movement. It means that the price of an asset continues to move between two levels. These levels are always respected, so the price does not move above the resistance level (top) or below the support level (bottom). This period of consolidation can be found in all timeframes and can continue indefinitely. However, consolidation will come to an end at some point. There are two possible scenarios.
Scenario 1: resistance level break
The resistance level represents the level where the price has difficulty going higher and is located at the top of a price chart. When the price breaks out above the resistance level during consolidation, it can be assumed that the price will continue to rise.
Scenario 2: support level break
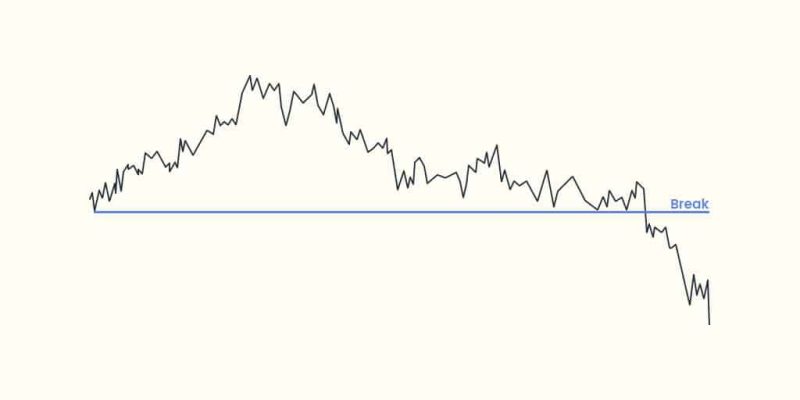
The support level represents the level at which the price can hardly go lower and is located at the bottom of a price chart. If the price breaks below the support level during consolidation it can be assumed that the price will fall further.
Levels
In this section, levels are split into two parts. Levels of support and levels of resistance. Support supports the price from going too low. Resistance resists the price from going too high. I recommend you read through support and resistance first and then come back here.
Marking a level
On a price chart, you can mark levels. These levels look like horizontal lines and represent a support or resistance level. These levels are useful in all timeframes, but it is important that you mark them in a certain order. You start at the high timeframe where you mark one or more levels. Then you move to a lower timeframe and do the same. You do this until you get to the smallest timeframe. Eventually, you have a chart on which several support and resistance levels are marked.
A tested level
When a level is tested, the price has jumped off the level. The price of an asset has touched a support or resistance level and is changing the price in the opposite direction. When your marked level is tested it means that your level is accurate (indefinitely).
A broken level
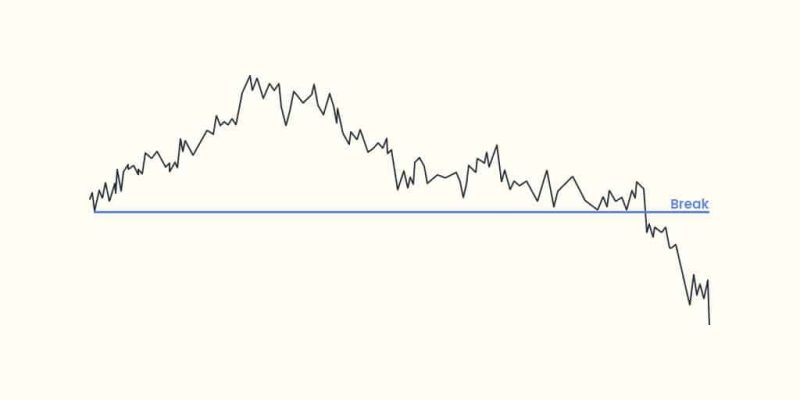
It can happen that the price of the asset drops or rises further, to a price below a support level or above a resistance level. When your first level is broken the price will simply move on to the next level. Therefore it is important that you mark several levels. You’ll learn more about this in “”.
Adjusting a level
A support level represents a level where the price cannot go lower. A resistance level represents a level where the price cannot go higher. But, when a level is broken this rule no longer applies and it is time to adjust your level. You adjust your level by simply moving it to the next lowest (support) or highest (resistance) price point on the chart.
Support
When the demand is lower than the supply, the price of an asset will fall. The duration of this process depends on increasing demand causing the price to rise. This increasing demand may arise from a lower price, positive news about the asset, or other positive events, as this makes a purchase attractive.
This is because people are already expecting a higher price to come. When demand again exceeds supply, the price will rise. The moment when the price has reached its lowest point is called the level of support. Support supports the price from going too low.
A tested level
1. The demand is lower than the supply;
2. The price of the asset decreases;
3. A positive event occurs;
4. The demand begins to increase;
5. The demand is higher than the supply;
6. The price of the asset increases;
7. The price has touched or created a level of support.

A broken level
1. The demand is lower than the supply;
2. The price of the asset decreases;
3. The demand remains lower than the supply;
4. The price continues to decline;
5. The price has broken through a level of support;
6. The price continues to the next level or repeats this process.
Resistance
When the demand is higher than the supply, the price of an asset will rise. The duration of this process depends on decreasing demand causing the price to fall. This decreasing demand can be caused by a higher price, negative news about the asset, or other negative events, as this makes a purchase less attractive. This is because people are already expecting a lower price to come. When demand falls below supply again, the price will fall. The moment when the price has reached its highest point is called the level of resistance. Resistance resists the price from going too high.
A tested level
1. The demand exceeds the supply;
2. The price of the asset increases;
3. A negative event occurs;
4. The demand begins to decline;
5. The demand is lower than the supply;
6. The price of the asset is decreasing;
7. The price has touched or created a level of resistance.

A broken level
1. The demand is higher than the supply offer;
2. The price of the asset increases;
3. The demand remains higher than the supply;
4. The price continues to rise;
5. The price has broken through a level of resistance;
6. The price continues to the next level or repeats this process.

Trends
A trend represents a development in a particular direction. This is a development that represents a decrease or growth in the price of an asset. This representation is expressed as a so-called trend line. This trend line runs downward (decrease) or upward (increase).
Trend vs Level
A trend is a level. There is only one difference. Trends run diagonally while levels run horizontally. Up and down trends actually work the same as resistance and support levels. An uptrend represents a resistance level that prevents the price from going too high. A downtrend represents a support level that prevents the price from going too low. Remember, a trend is a level.
Uptrend
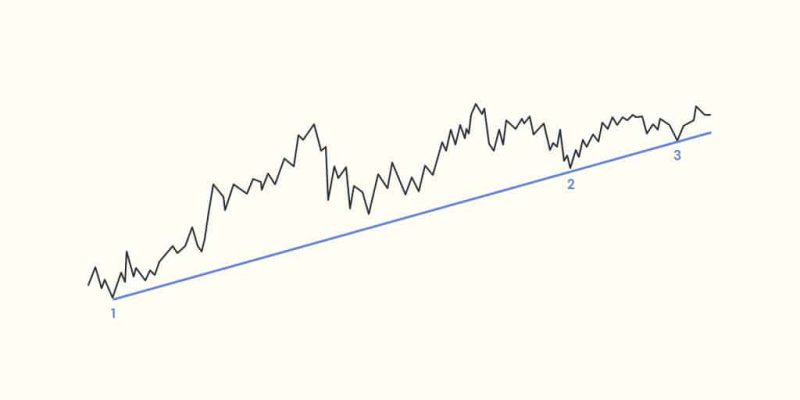
An upward-moving line, or an uptrend, represents an increasing price value of an asset. The price of an asset is in an uptrend if the price trend is as follows;
1. Every price high is followed by a higher price high;
2. Every price low is followed by a higher price low.
Marking an uptrend
An uptrend can be marked simply by connecting several price lows. For an uptrend to be valid, at least three price lows must combine to create the uptrend.
Downtrend
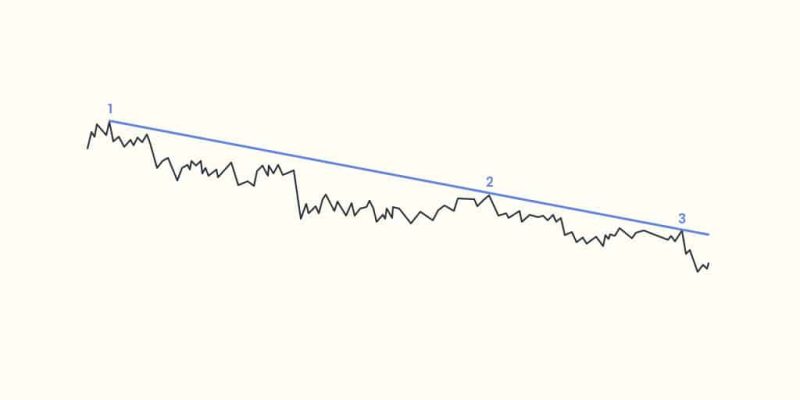
A downward moving line, or a downtrend, represents a declining price value of an asset. The price of an asset is in a downtrend if the price trend is as follows;
1. Every price high is followed by a lower price high;
2. Every price low is followed by a lower price low.
Marking a downtrend
A downtrend can be marked simply by connecting several price highs. For a downtrend to be valid, at least three price highs must combine to create the uptrend.
Targets
A target is actually a level, but it differs in that it is the level where you actually want to buy or sell an asset. By placing targets on your chart you reduce the risk and the trade actually becomes more logical. Placing targets can be done in several ways, but there are a few key actions that ensure you minimize your risk.
1. Place multiple targets on your chart and keep adjusting them based on an asset’s price action.
2. Mark targets with a different color so you can distinguish them from “normal” levels.
3. Never let FOMO rule, but stick to the plan. There is no guarantee that your target will actually get hit. If your target is not hit, move on to the next trade.
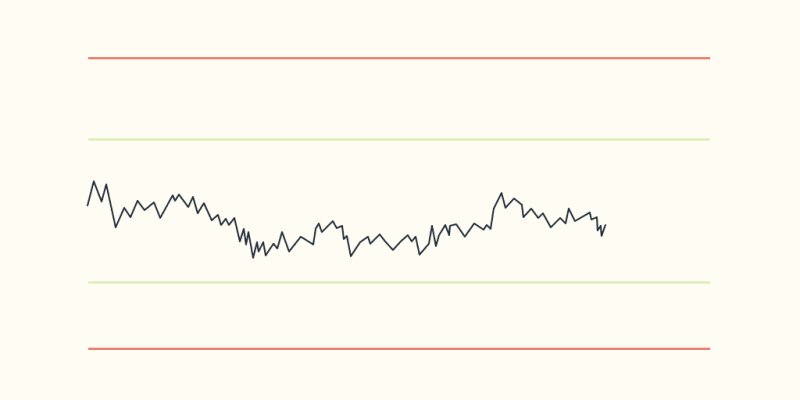
In the example below, two targets have been placed. A buy target and a sell target. The lower orange line represents the buy target, the lower the purchase price, the more attractive and therefore the better. Always aim for the lowest possible entry price to minimize your risk. The upper orange line represents the sell target, never be too eager and never assume the highest possible level. Sell proportions of your assets at certain targets to minimize your risk.
Timeframes
A timeframe refers to a period of time in which a candle opens and closes. Let’s take a 1-hour timeframe as an example. In this timeframe, you will see the price movement per hour. So every candle equals 1 hour.
If you reduce the timeframe to 15 minutes, then each candle equals 15 minutes. In 1 hour you can fit 4 times 15 minutes. This means that 4 candles of 15 minutes equal 1 candle of 1 hour. There is a simple rule when we talk about timeframes;
“The larger the timeframe, the more reliable the data. The smaller the timeframe, the less reliable the data.”
Using timeframes
Different traders use different timeframes, think about the different types of traders. Each individual trader will have a preference toward their own timeframes. They can be combined in many ways, but there is a simple rule that allows you to get the most out of your timeframes: work from large to small timeframes.
You use the higher time frames to highlight trends and levels. You use the lower time frames to determine your final buying and selling points. In lower time frames, you spot the ultimate moment to buy or sell an asset based on market volatility. After the buy or sell, you zoom back out to the higher time frames and repeat the cycle.
Making Own Strategy
To optimize success and minimise losses, strategy is undoubtedly the most important aspect. A strategy ensures that you will trade based on knowledge and not on feelings. Therefore, it is necessary to have a rock-solid strategy. On this page, we will not go into what kind of trader you are. This is simply not necessary yet. Remember, we are learning how to follow other crypto callers, not how to create your own technical analysis.
Step 1: starting capital
You don’t need loads of money to start trading. Anyone who tells you this is lying. Start with money you can miss. Don’t start trading with all the money you have. Make an overview of the money and assets you have at your disposal. Then decide how much of this money you want to use to execute trades. It is recommended to use not more than 5% of your total assets. This way, you minimize the risk you take.
Example
1. I have €1000 in my bank account
2. I have €500 in cryptocurrency
3. My total assets are €1500
4. My initial capital will be €75 (€1500 * 5%)
Step 2: targets
Before starting anything, knowing what you want to achieve is a must. This also applies to asset trading. The goals you set to follow crypto callers’ calls are different from the goals you would set if you were trading based on your own technical analysis. The focus is now on the results to be achieved and not so much on the strategy you use to execute trades independently. There are many types of goals you can think of. The three goals listed below are just some general goals that should be used by anyone who wants to follow up calls from other crypto callers.
1. How many trades do I want to follow up daily?
2. How much profit do I want to make within a certain period of time?
3. Which crypto callers am I going to follow, and which not?
Step 3: awareness
Making yourself aware of how things work is a priority. You don’t want to make mistakes you could have avoided by simply learning a little more. The biggest example that can be mentioned here is how an exchange works when you trade with leverage. Leverage means that the leverage amount you choose is multiplied by your deposit. Leverage has the same application to profit and loss. In this example, the focus is on loss. Suppose you have €75 (100%) as balance and you open a trade for €7.50 (10%) with a 10x leverage. You now actually open a trade for €75 (100%).
You borrow the remaining €67.50 from the exchange, everything you borrow must also be repaid. After executing the trade, you’ll see that your trade has a negative result of 80%. Due to leverage, this means you actually only have 20% of your balance left. A while later, your trade is at a negative result of 100% and your trade is automatically closed by the exchange, because you no longer have any balance left. Your balance has dropped to €0. This is just one of the many things you need to be aware of. Below is a short list of the must-knows before you start executing trades.
1. Know how the exchange you are using works.
2. Know the risks involved in using leverage.
3. Know when a trade can be closed automatically.
4. Research everything you are not sure of how it works.
Step 4: risk management
It’s time for risk management, perhaps the most important concept for minimizing your losses and maximizing your profits. Let’s get started. Your starting capital is €75 (taken from the example in step 1). How much of this amount are you willing to risk during one trade? Many traders use a percentage of 5% per trade. In our case, this would mean that you would open a trade with €3.75. Now you will probably think “how can I ever get rich with this?”. The answer is simple: compound effect. Suppose you open a trade for €3.75 and then close it for €7.50.
Your balance is now €82.50 (€75 + €7.50). The next trade you open again with 5% of your balance. This time you open a trade with €4.12 and close it for €7.50. Your balance is now €90 (€82.50 + €7.50). It goes on like this constantly. Of course, you have no guarantee that you will make a profit every trade, but by using a small percentage of your balance to trade, you do minimize the risk of losing everything at once. It is better to take small steps to build up capital than to take one big step and lose your entire balance at once.
Step 5: notifications
Once you have completed the previous four steps, only one more step remains to be able to execute trades. Setting up notifications. Crypto callers post their calls in Discord, on Telegram, or on Twitter. The calls that are placed will often need to be followed up quickly. If you miss an indicated entry price, it is a big risk to still open the trade. That is why it is so important to be notified immediately when the crypto caller you are following places a call.
Setup
Before you can start trading, you need a setup. This setup requires only two tools: a charting tool and an exchange. It is important to repeat once again: you shouldn’t start trading based on “your own technical analysis” after learning level 1. You have no understanding of how technical analysis work after level 1. The least you can do is to follow crypto analysts with a positive win/loss ratio.
Charting Tool
The price action of an asset is displayed in a chart. The tools in which these charts are displayed are charting tools. By using a charting tool, you minimise the risk when you trade. Instead of trading blindly, it is much better to mark levels, trends, and targets on a chart.
There are several types of charting tools, but here we will take TradingView as an example. The topics related to TradingView explained below, are the only ones that are important for now. It is not necessary to use indicators.
TradingView Beginner’s Guide
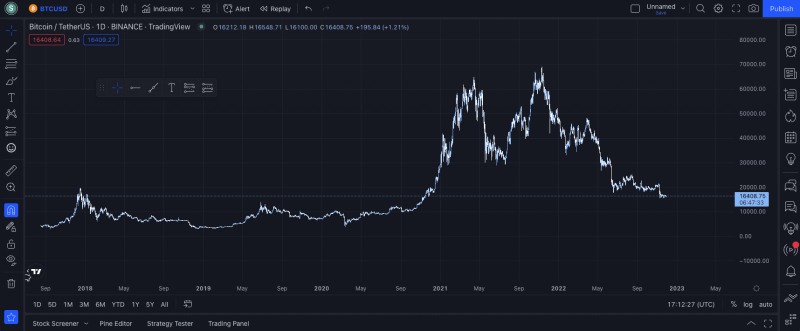
The TradingView interface consists of a large number of tools. This can be overwhelming at first sight. Most of the tools you will probably never use. The tools you will use will all be listed here.
Chart
The chart is what it’s all about. In a chart, you see the price movement of an asset. In this case, the price movement of Bitcoin. The price movement is shown in candles. These candles together form the line you see on the chart.

Drawing Tools
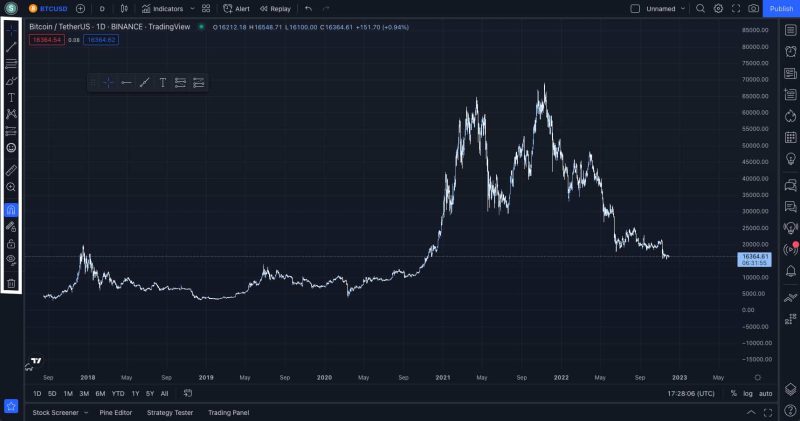
Drawing tools allow you to draw marks on the chart. The tools you use most often can be pinned in your favorite drawing tools bar.
Favorite Drawing Tools Toolbar (FDTT)
If you want to trade efficiently, a properly set FDTT is essential. In the example below, the FDTT is highlighted. You can add tools to the FDTT by clicking on the star next to a drawing tool. An explanation of the tools in the example FDTT follows down below.
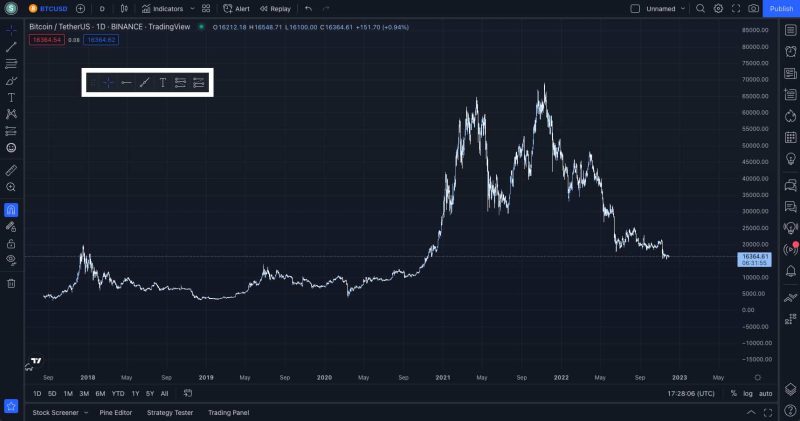
Cross: drag through the chart.

Horizontal ray: place a horizontal line on the chart (support, resistance, levels, targets).
After placing the horizontal ray, you can click on it. A menu appears where you can adjust the style, text, coordinates, and visibility. You can also save templates here.


Ray: place a diagonal line on the chart (support, resistance, trends).
You can also click on a ray. The same menu appears, but the options you now have to choose from differ. The default settings are perfect to use.

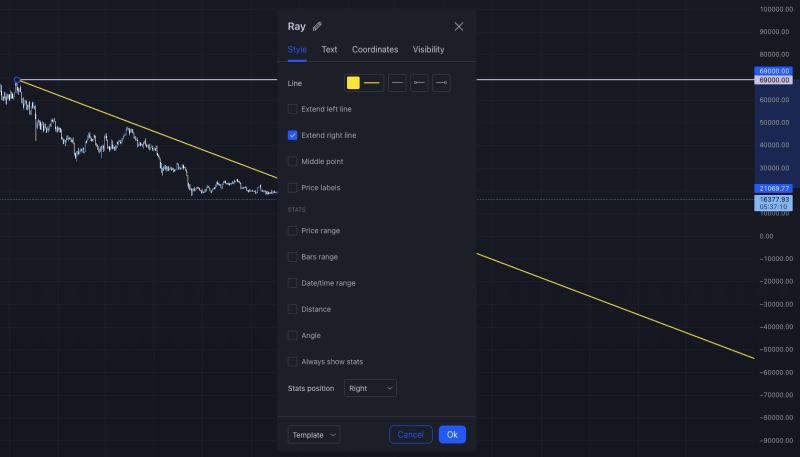
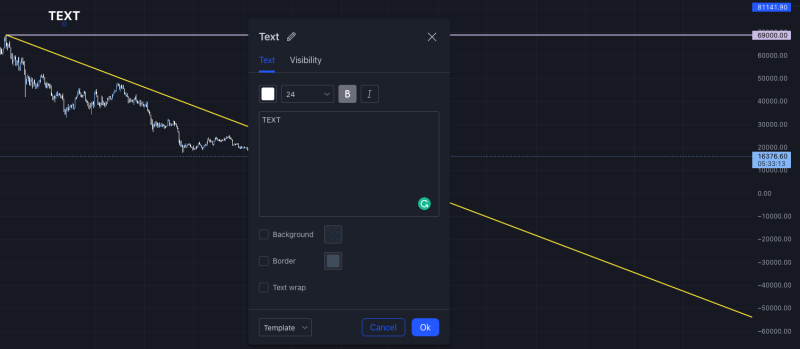
Text: place notes on the chart.
By clicking on the text tool and then on start, a menu appears. In this menu, you can change the text, colour, size, and other details.

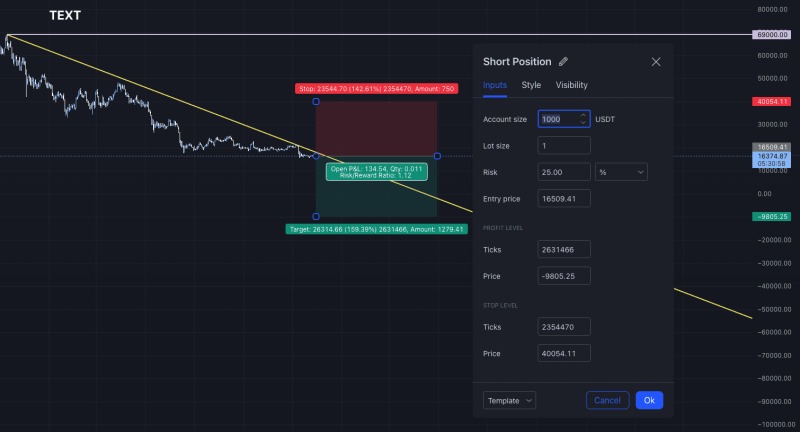
Short position: places two areas. Red area: loss. Green area: profit.
By clicking on the short position, a menu appears. It is useful to enter the profit level and stop level here so that you know in which direction your trade is going and how long it will be before your Profit or stop level is realized.

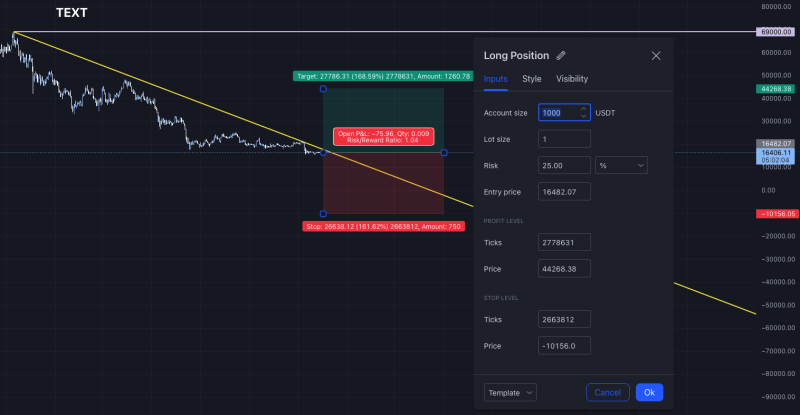
Long position: places two areas. Red area: loss. Green area: profit.
By clicking on the Long Position, a menu appears. It is useful to enter the Profit Level and Stop Level here so that you know in which direction your trade is going and how long it will be before your Profit or Stop Level is realized.

Symbol Search
Symbol search allows you to search for the asset you want to research or trade. Click on the asset (in this case BTCUSDT, top left) and symbol search will appear. You can search for stocks, futures, forex, crypto, indices, bonds, and economy related assets.

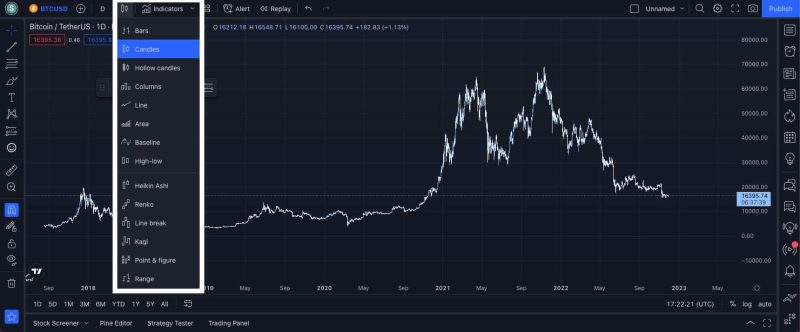
Candles
You can personalize your chart by choosing candles. It is recommended not to change the default settings. Use “Candles” or “Hollow Candles”.
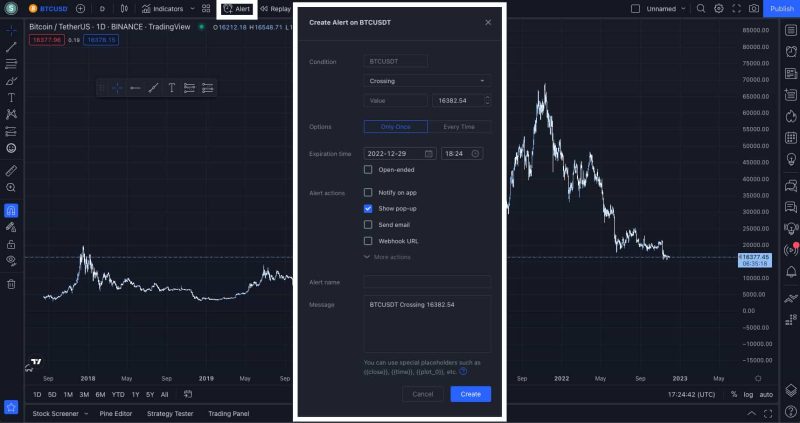
Alert
By setting an alert, you will receive a notification when an asset has reached price X. By X, we mean the price you enter. It is advisable to install the TradingView app. If you log in to the app with the same account as on your desktop, you will receive notifications on your phone.
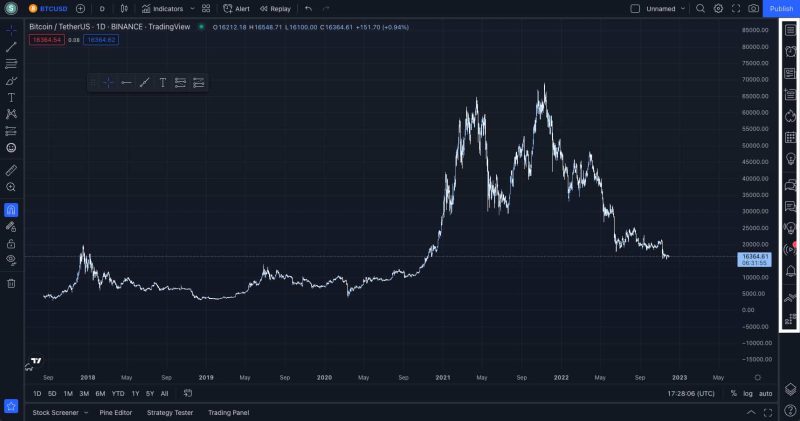
Other Tools
Other tools can be found on the right-hand side of the interface. Navigate through these yourself. See what options there are and which ones you could use. What works for person 1 may not work for person 2. That is why it is important to find out what works for you.
Futures
A derivative is a product or contract with a value determined by an underlying asset. In traditional financial markets, derivatives derive their value from assets. Examples of these assets are cryptocurrencies, stocks and fiat currencies.
The operation behind crypto derivatives is exactly the same as traditional derivatives. This is because a contract is entered between the buyer and seller to sell an underlying asset.
This contract contains details such as when the asset will be sold and at what price it will be sold. No value is attached to the derivatives themselves, but to the underlying asset. Another feature of derivatives is that they do not hold the underlying asset. Also, derivatives do not own the underlying asset. There are several crypto derivatives, but we will now focus on “crypto futures”.
Crypto futures
With futures, a buyer and a seller agree to sell an asset at some point in the future. Additionally, the precise time and sum are determined in advance. Although some contract details may differ, the terms are often the same.
Simply put, cryptocurrency futures are contracts in which two investors bet on what the price of a cryptocurrency will be in the future, without having to buy it. The investors do not buy the cryptocurrency but bet on the underlying assets.
Pros:
Futures contracts allow investors to make predictions about the course of an underlying asset’s price.
To guard against unfavorable price changes, businesses can hedge the price of the items they sell or the raw resources they use.
Futures contracts may only need a tiny portion of the total contract value to be deposited with the broker.
Cons:
Futures use leverage, so investors run the risk of losing more than their initial margin.
A corporation that hedged its exposure can lose out on positive price fluctuations if it invests in a futures contract.
Gains can be amplified but losses can also be, making margin a double-edged sword.
Operation of crypto-futures
You can trade crypto-future on exchanges. Again, we will use Bitget as an example. When you trade crypto futures, you predict whether the price of a cryptocurrency will go up or down. Earlier we talked about long and short positions, this principle is applied here in combination with leverage. Leverage means that the trader does not have to pay the 100% stated on the contract, but only part of it. Instead of paying the full 100%, the exchange requires an initial margin amount, which consists of a fraction of the total contract value.
Trading crypto-futures
You have a certain number of options:
Cross margins or isolated margins;
Leverage multiplier;
Open a new position or close an opened position;
Open or close the position with a limit, market, or trailing stop order;
Your available balance in USDT The amount you want to bet (options differ for limit and trailing stop orders);
Set a take profit and stop loss level (this can also be done after opening the trade);
Open a long position by clicking on “Buy long”;
Open a short position by clicking on “Sell short”;
The costs to open the contract.
Opened long or short Position
After opening a position in Bitget, containers of information like this will appear on your screen. A long position is marked by a blue heading, while a short position is marked by a red heading. Let’s go through the image of the long position. At the top left, you see the attribute for the position, “long”. Next to it, you see the leverage, “25X”. Next to that you see the cryptocurrency, BTCUSDT in this case. Next to that again, you can adjust the leverage. All the information you see underneath the heading is not explained here. By opening a position and moving your mouse over the words, the definition will appear.
Positions
A position is an expectation a trader has about a particular asset. By opening a position, you expect the price of an asset to go up (long) or down (short). There is also a difference between open and closed positions. It goes without saying, but an open position is a position that is still open. A closed position is a position that is closed.
Position Definition
Depending on the asset you are trading, the meaning of a position may change. For instance, a position with a specified transaction date is known as a “futures position”, whereas a position for immediate delivery of a currency or commodity is referred to as “spot.”
Short Position
When a short position is opened, the price of an asset is expected to go down. You make a profit if the asset price is lower than the asset price on which the short position was opened.
Long Position
When a long position is opened, the price of an asset is expected to go up. You make a profit if the asset price is higher than the asset price on which the long position was opened.
Orders
An order is a request. It’s as simple as that. An order is a request sent to an exchange to buy or sell a particular asset. The trader sends the request to the exchange. When the price of an asset meets the details in the request, the exchange will execute the trade. There are different types of orders, but the main ones are market and limit orders.
Market order
When a market order is placed, the trade is executed immediately. There are two types of limit orders: market-buy orders and market-sell orders.
Market-buy order
When placing a market-buy order, you buy an asset at the current price.
Limit Order
When placing a limit order, the trade is executed when the activation price is reached or better. There are two types of limit orders: limit-buy orders and limit-sell orders.
Limit-buy order
When placing a limit-buy order, you buy an asset when the activation price is reached.
Margins
Margin trading is a form of trading that allows you to play with more money than you actually own. Simply put, it amounts to borrowing money from a trading platform based on your assets with which you can then invest. An investor thus only needs to have a fraction of the funds on a platform to open a much larger position.
This means you only need a small fraction of the money to open the full position, which is called the ‘initial margin’. Cross margin is typically the default setting on most trading platforms because it is the simpler strategy ideal for new traders. Isolated margin , however, can also be helpful for riskier trades that demand stringent downside restrictions.
Cross Margin
Cross margin mode is a mode that exchanges allow you to choose. To prevent liquidation, the whole margin balance is distributed among all open positions when using cross margin mode. In the case of a liquidation, if Cross Margin is enabled, the trader runs the risk of losing both their entire margin balance and any open positions. Any realized PnL (profit and loss statement) from a position that is close to being liquidated can help a losing position.
Isolated Margin
The margin balance allocated to a certain position is known as isolated margin. By limiting the amount of margin allocated to each position, traders using the isolated margin mode can control the risk associated with each of their unique positions. Each position’s allocated margin balance can be changed separately.
When a trader liquidates a position in isolated margin mode, just the isolated margin balance is liquidated, not their full margin balance.
For illustration, suppose you opens a long trade with 10x leverage in BTC valued 1000 USD. You have a 2000 USD margin balance, but you only want to risk a fraction of it on one trade. You choose a 100 USD isolated margin for the position. You won’t lose more than $100 USD in the event that your position is liquidated.
For open positions, the isolated margin amount can be changed. The liquidation of a trade in isolated margin mode can be stopped if there is still time to add more margin to the position. On the other side, when a position has been opened, it is not possible to change the related margin method. Before taking a position, it is strongly encouraged to examine the margin mode settings.
Targets
If all goes well, you already know what targets are. This subject was covered in level 1. Targets are used when you make your own technical analysis, but you can also use them to follow up calls made by crypto callers. When a crypto caller places a call, it will most probably include an entry target, profit target, and stop target.
Entry
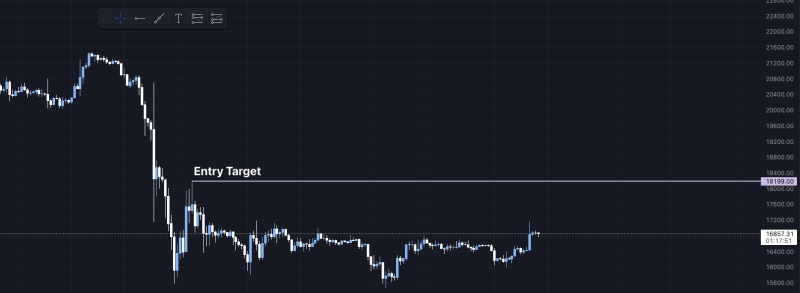
The entry price is indicated by the crypto caller. Based on this information, you can do two things. You can keep watching the price manually or you mark the entry price as a target and set an alert. Option two is undoubtedly the action you want to take. Below will describe the process as it happens in reality.
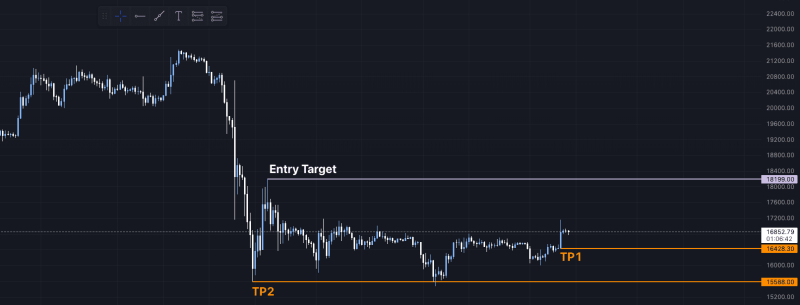
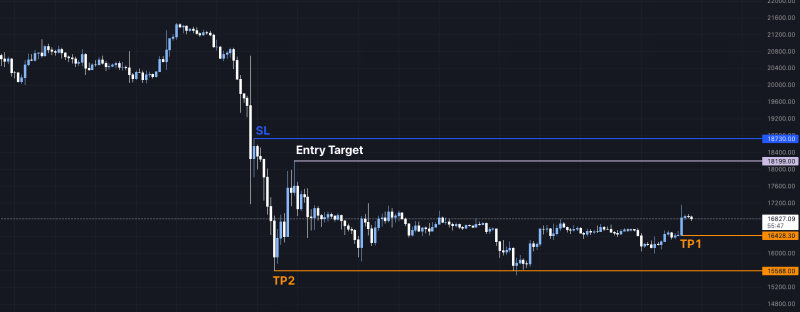
A call appears. Asset: BTCUSDT. Position: short. Entry price: $18.199;
You place an “Entry Target” (through a Horizontal Ray) in the chart;
You set an alert (in the example on TradingView);
You receive an alert and decide to open a short position on BTCUSDT for $18,199.
Stop Loss (SL)
A stop loss level is often referred to as “SL”. In fact, only one stop loss level is displayed. When you know the SL level, you want to do two things. First, you want to mark the SL level on the chart. Second, you want to instruct your exchange to close the position when the SL level is reached.
Chart example
A call appears. Asset: BTCUSDT. Position: short. Entry price: $18,199. SL: $18,730;
You place an “SL” (through a Horizontal Ray) in the chart.
Take Profit (TP)
A take profit level is often mentioned as TP. When more than one take profit level is mentioned, it is marked with numbers. Take profit level 1 = TP1, take profit level 2 = TP2, take profit level 3 = TP3, etcetera. When you know the TP level, you want to do two things. First, you want to mark the TP levels on the chart. Secondly, you want to instruct your exchange to close the position when the take profit level has been reached or when the take profit levels have been reached. On several exchanges, you can set your position to be partially closed at certain levels. In the exchange example below, we only work with one take profit level.
Chart
A call appears. Asset: BTCUSDT. Position: short. Entry price: $18,199. TP1: $16,428.30. TP2: $15,588;
You place a “TP1” and “TP2” (through a Horizontal Ray) in the chart.
